This is part two in a series about using Stack and Reach to understand bike design. Our previous post was about the shortcomings of Stack to Reach Ratio and today we’ll talk about our solution to those shortcomings: the Upright-Aggressive Scale, a powerful new feature available at Bike Insights.
We’re particularly proud of this type of insight because it’s simple to understand and is going to help beginner and experienced cyclists alike avoid buying the wrong bike.
In fact, we created this scale after experiencing firsthand just how difficult it is to pick the right bike the first time around. When I bought my first “adult bike” with drop bars, I was sold a model which caused me extreme discomfort. I didn’t know any better, the salesperson probably didn’t know any better, and I just assumed that discomfort was the price to pay if I wanted to ride bikes. Now I take great satisfaction in looking up that bike on Bike Insights and finding that it is “Very aggressive” and an outlier even amongst the other sizes of that model.
Of course, when I bought my first mountain bike, I swung too far in the other direction and bought a bike that was too upright for me. I now find that bike is classified as, sure enough…”Somewhat upright”. If only Bike Insights were around back then!
What exactly is the Bike Insights Upright-Aggressive Scale?
The scale lives in the “INSIGHTS” section of our bike profiles and in the Bike-on-Bike Compare. It describes how upright or aggressive the design of a bike frame is versus other bikes in its category (e.g. versus other Touring Bikes or versus other Performance Road Bikes). Values are based on each bike size’s individual Stack and Reach measurements compared to the overall category’s Stack and Reach trend.
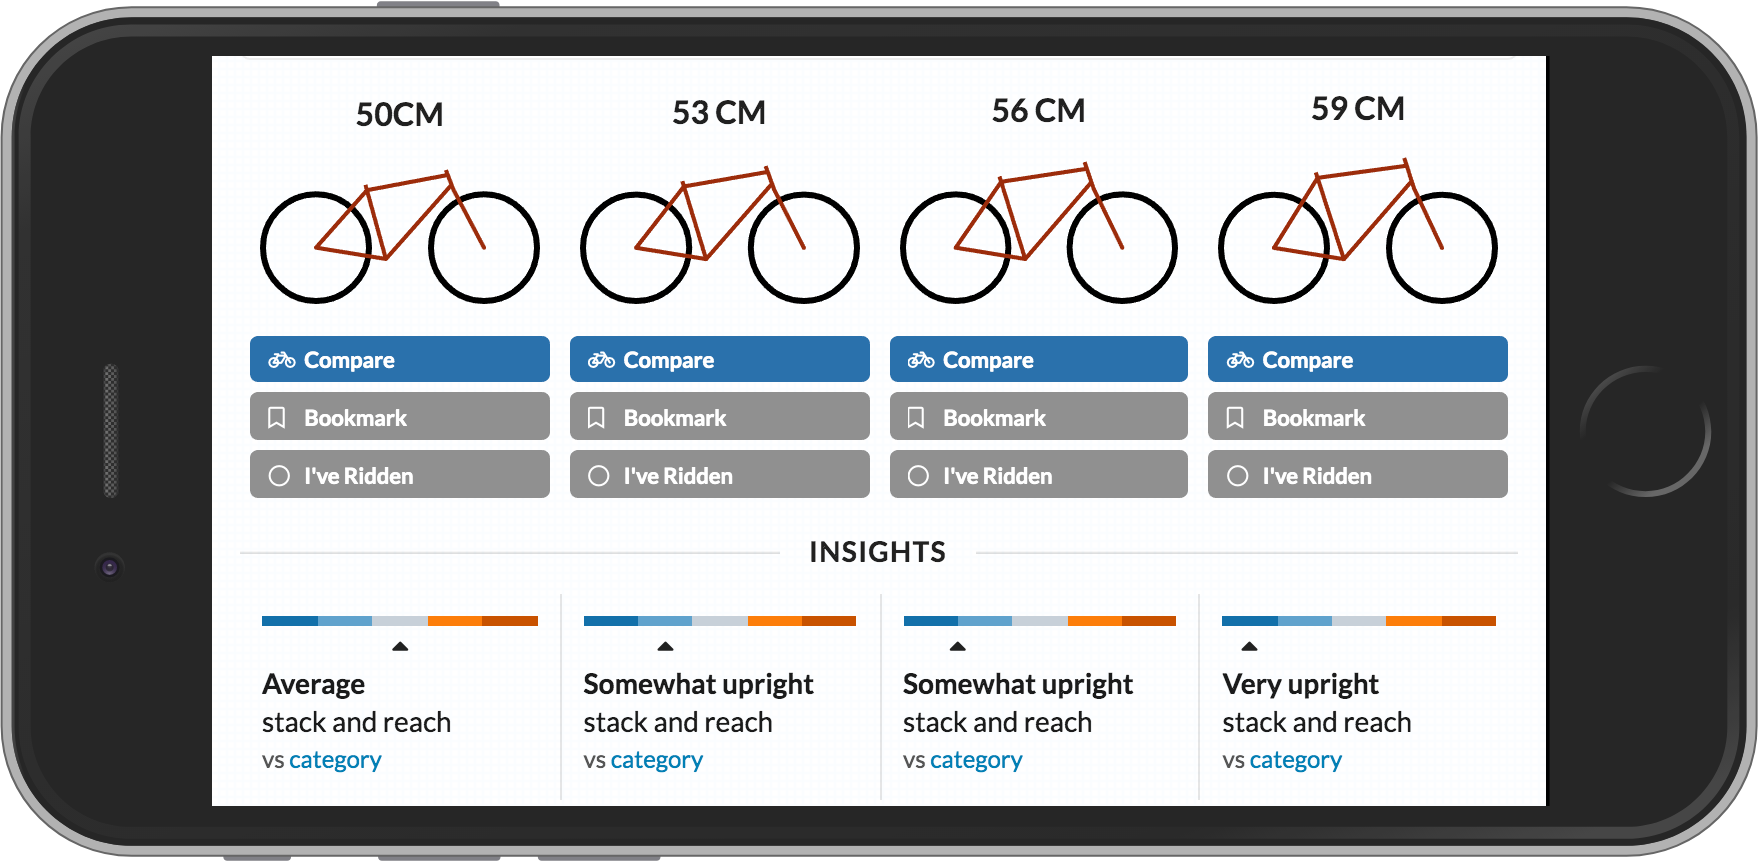
Yep, I’m about to write 2000 words about that little meter in the INSIGHTS section.
The scale is broken into five segments which are color coded from dark blue to dark orange. Additionally, we have meticulously translated these segments into emojis for your convenience. Feel free to print this out and carry it in your wallet as a reference:
| Scale Value | Very Upright | Somewhat Upright | Average | Somewhat Aggressive | Very Aggressive |
| Animal | 🦒 |
🦍 |
🐫 |
🦌 |
🐆 |
| Smiley |
🤗 |
🙂 | 😐 | 😠 | 😡 |
| Scale Value | Animal | Smiley |
| Very Upright | 🦒 | 🤗 |
| Somewhat Upright | 🦍 | 🙂 |
| Average | 🐫 | 😐 |
| Somewhat Aggressive |
🦌 | 😠 |
| Very Aggressive | 🐆 | 😡 |
It’s important to understand that that this scale is based on the design of the bike frame alone and does not take into account important components of fit such as handlebars and stem. The final fit of an aggressive frame design can be made upright by adding a taller or shorter stem, more spacers, or shorter reach handlebars. On the other hand if you’re looking for a more aggressive fit, an upright frame design may prevent you from getting the handlebars low enough.
Keep in mind that some categories, such as Touring Bikes are generally more upright so even an “aggressive” Touring Bike can be relatively upright compared to the average Performance Road Bike.
Now that you are an expert on the scale, you can use it to do things like:
- Identify if the bikes you’ve ridden are more upright or more aggressive than average so you’re more prepared when searching for your next bike.
- Determine when components may need to change to achieve a similar fit when moving to a more aggressive or more upright design.
- Compare the design of a bike in your size versus the size a reviewer tested.
- Seek outlier frame designs that might pair better with alternative handlebars.
- Create custom, dynamic searches such as Upright Touring Bikes or Aggressive Hardtail Trail Bikes.
A more detailed explanation
Now let’s look at how this scale relates to another visualization on Bike Insights, the Stack and Reach vs. Category Trend chart. This chart is available on bike profiles and, in a sense, can be seen as a more detailed version of the Upright-Aggressive Scale.

Each dot on the chart represents the Stack and Reach coordinates of a single bike size. The gray line represents the Stack and Reach trend of bike’s assigned category. The example above shows six sizes of a bike model compared to the Cyclocross category trend line. This bike follows the trend line quite closely so we classify all of these sizes as being “Average” on the Upright-Aggressive Scale. In other words, the proportions of this bike are just about what we would expect of a prototypical Cyclocross bike.
Let’s look at another example:

Unlike the nice-and-tidy chart we looked at previously, this bike does not track consistently with the Cyclocross trend line. This is where we start to classify geometries as being “upright” or “aggressive” depending on which side of the trend line they fall on. Above and to the left of the trend line is more upright and below and to the right the trend line is more aggressive. The farther a point is from the trend line, the more upright or aggressive the design is considered to be. Using the example above, size 64 is above and to the left of the trend line but is still reasonable close it it so we classify this size as “Somewhat upright”. Size 68 is far enough away from the trend line that we classify it as “Very upright”.
The super-detailed explanation
For those of you who are familiar with interpreting Stack and Reach, translating these measurements into upright and aggressive may seem like an oversimplification. After all, we are taking a two-dimensional, cartesian coordinate system and simplifying it into a one-dimensional scale. Isn’t that overly reductive?
Nope. We have an ace up our sleeve.
It turns out that we’re not just using Stack and Reach in this scale. There is third, dark and mysterious geometry attribute at play…
Yes, the Upright-Aggressive scale, much like its creators, is smarter than it looks. But if I come right out and tell you what else else we’re doing, you’ll think we’re crazy. Let me explain by giving a textbook example of how Stack and Reach are easily misinterpreted.
In 2018, Crust Bikes made some changes to their Evasion frame and folks started coming to me asking about the dramatic changes afoot. Nail-biting suspense ensued as they described the new model as being “longer and lower”.
Here are the changes for the “Extra Medium” size frame of that bike:
| Year | Stack | Reach |
| 2016 | 606 | 376 |
| 2018 | 576 | 382 |
| Difference | -30 | +6 |
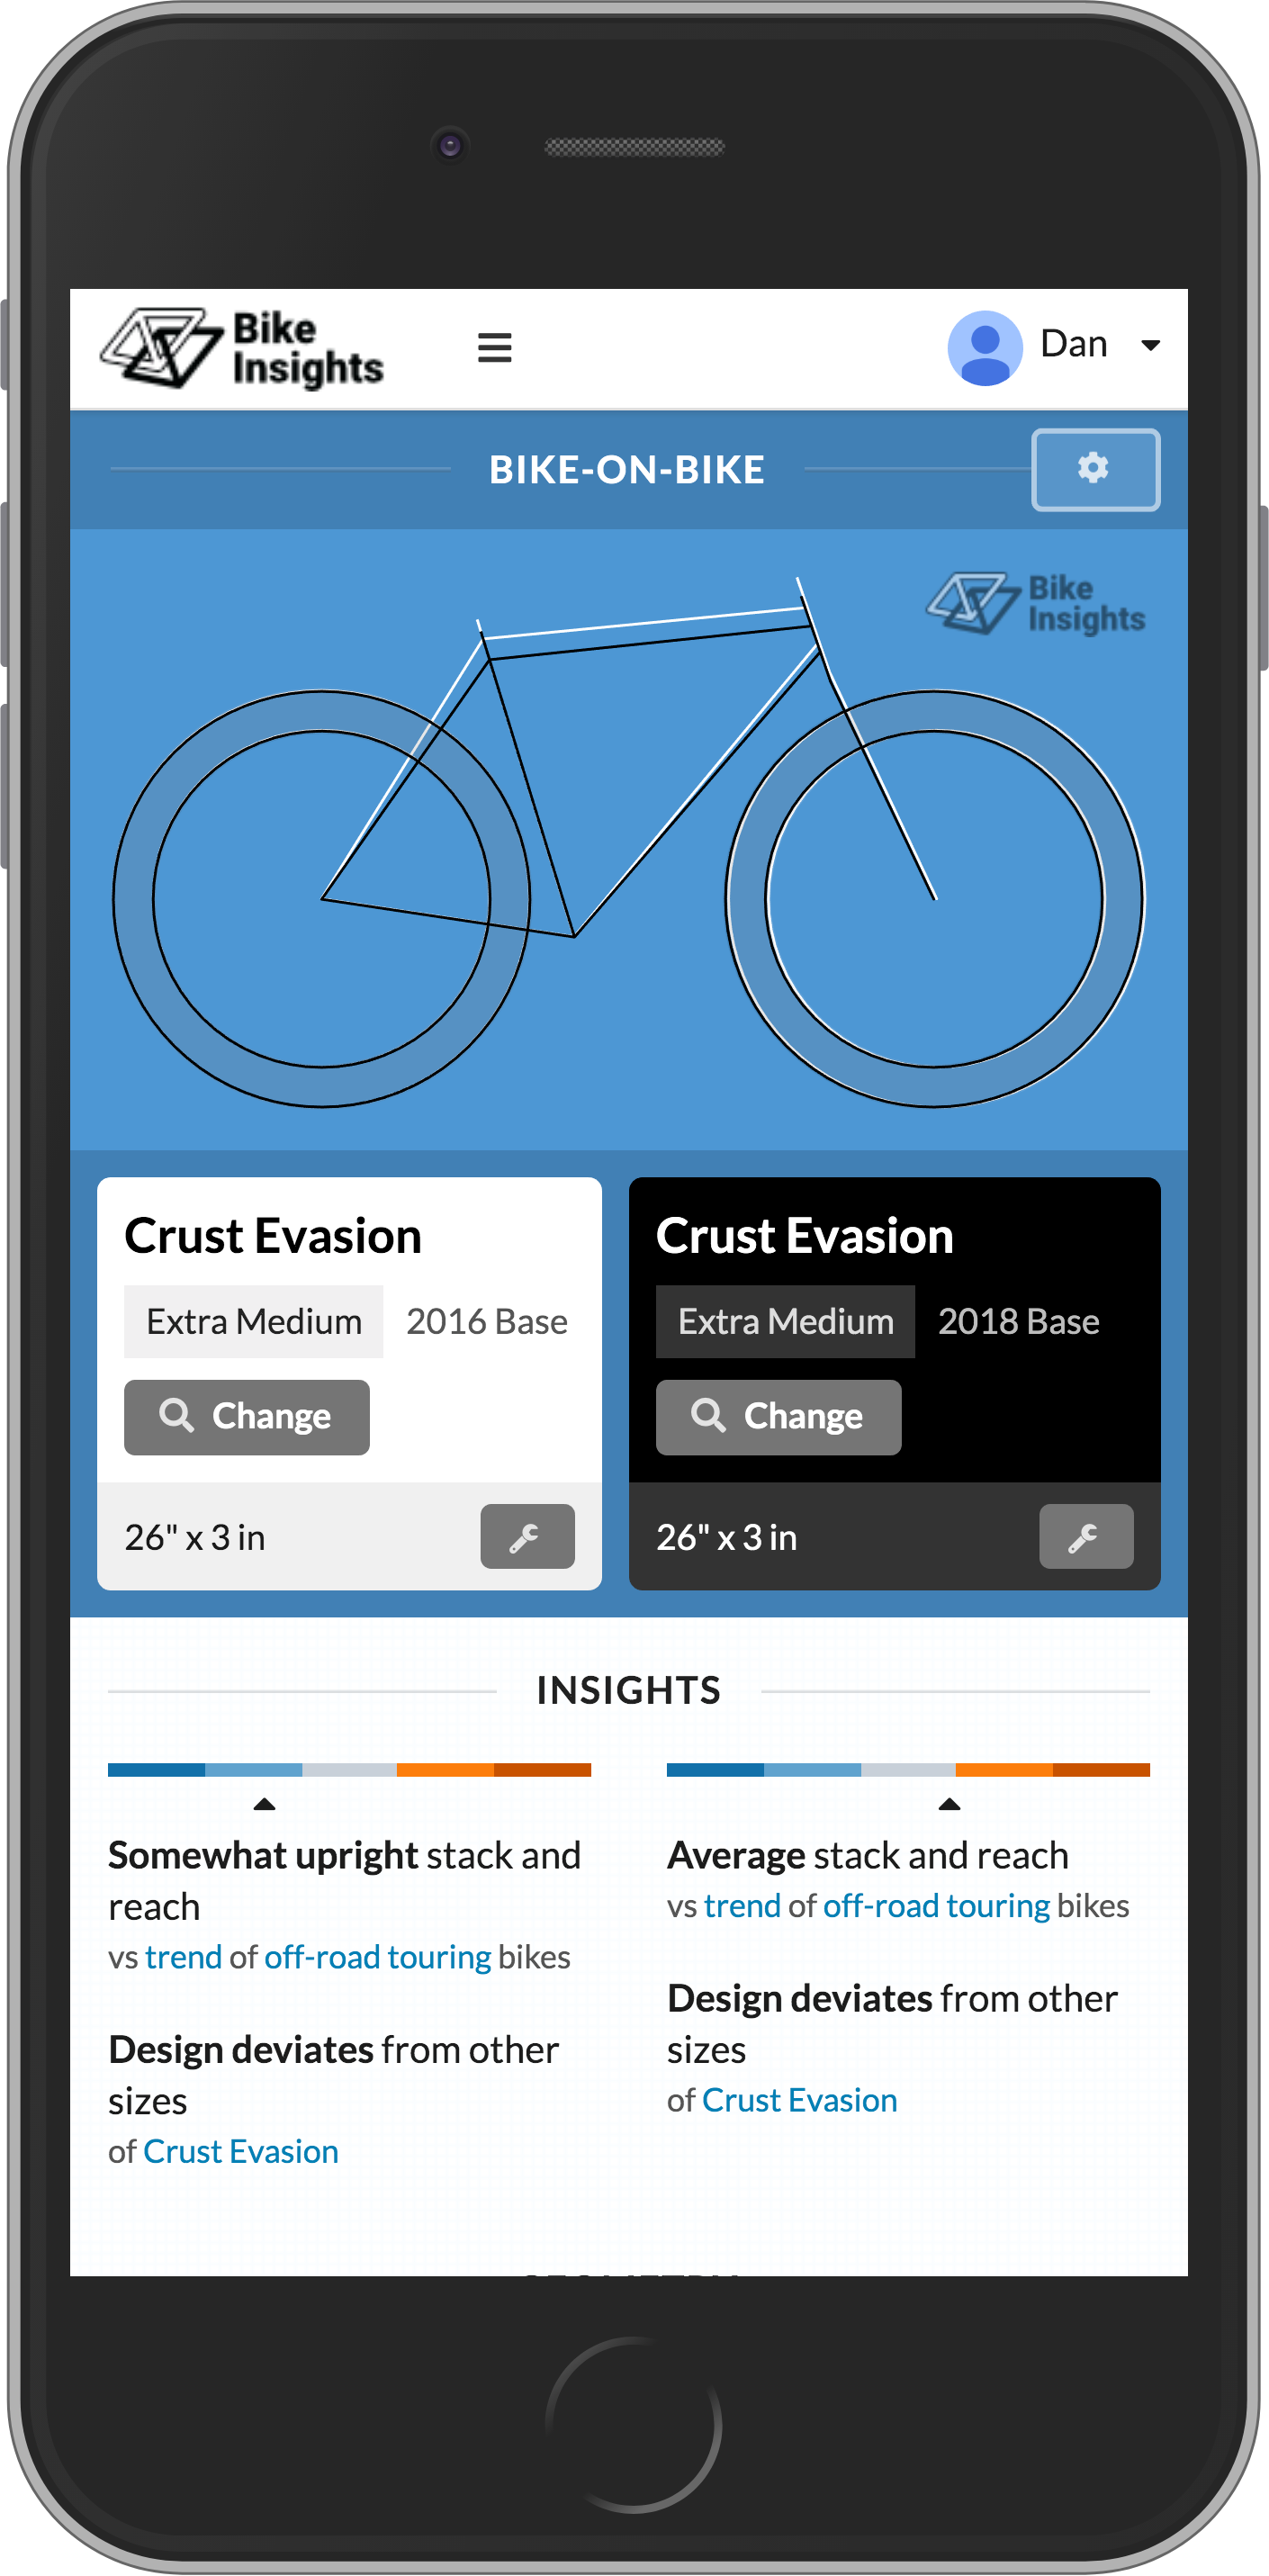
A 30mm change in Stack and 6mm change in Reach is a big change to be sure. The numbers suggest a totally differently fitting bike. But looking at the Bike-on-Bike Compare tells a different story:
It took all of three seconds looking at these bike diagrams to see that the overall effect of changing the Evasion’s Stack and Reach was to lower the standover a bit. The design is otherwise almost identical and it’s simply a matter of adding a few spacers under the stem to achieve the same fit.
Describing this bike as having a lower Stack and longer Reach is accurate, but it sort of misses the point.
The important aspect of this comparison is that the two bikes have head tubes in about the same position so they are still the same size bike. The difference is that one is slightly more upright than the other.
To determine when head tubes align on the same axis like this, we use Head Tube Angle (or steering axis).
You’ll recall that we classify the degree of uprightness or aggressiveness of a design based on distance from the trend line. However, you might be surprised to learn that we measure that distance along each bike’s steering axis. Just as we used this to see that the two Evasions above were closely related in size despite having different Stack and Reach values, so we use it across all bikes in our calculations. Here’s what that looks like:
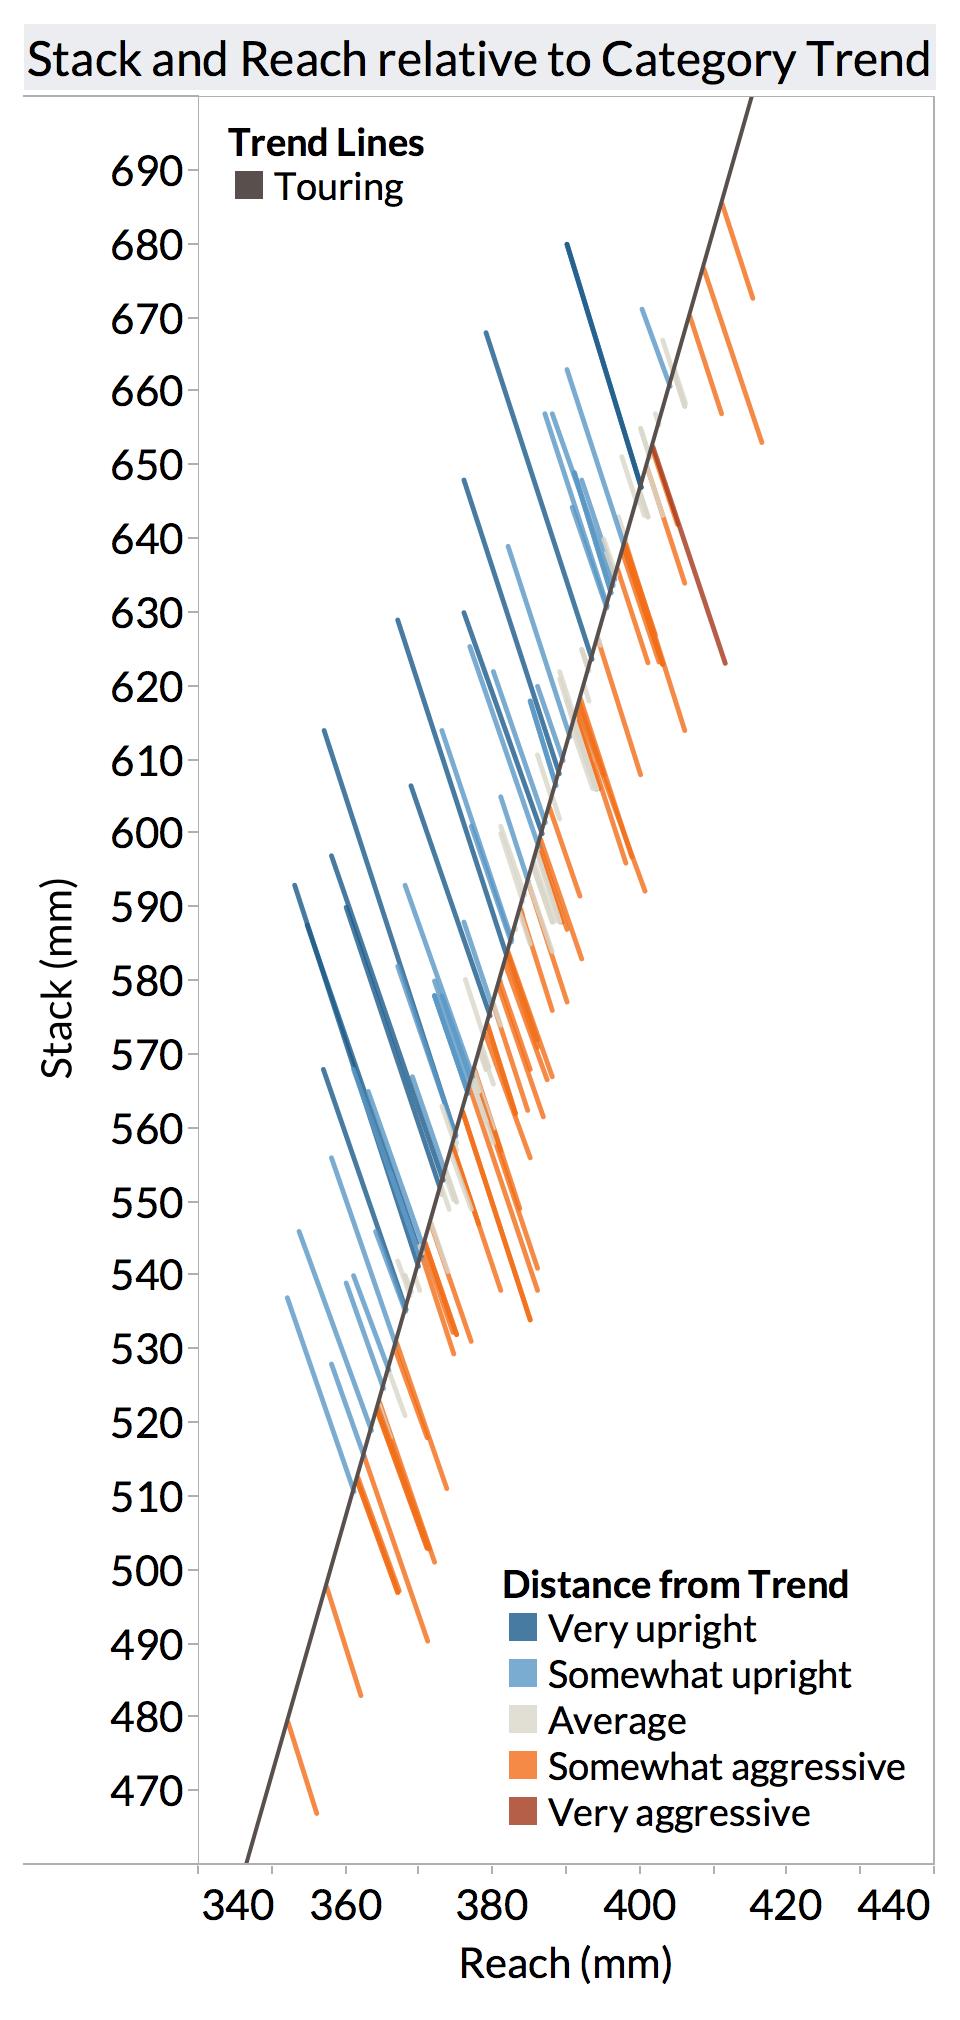
Example 1:
The dark gray line in the chart above shows the Stack and Reach trend for the Touring Bike category. The colored lines extending from the trend line show the distance to each bike’s stack and reach point along along a path determined by that bike’s steering axis. The distance of these lines determines which classification we assign:
- >30mm = Very upright or aggressive
- 10mm – 30mm = Somewhat upright or aggressive
- <10mm = Average
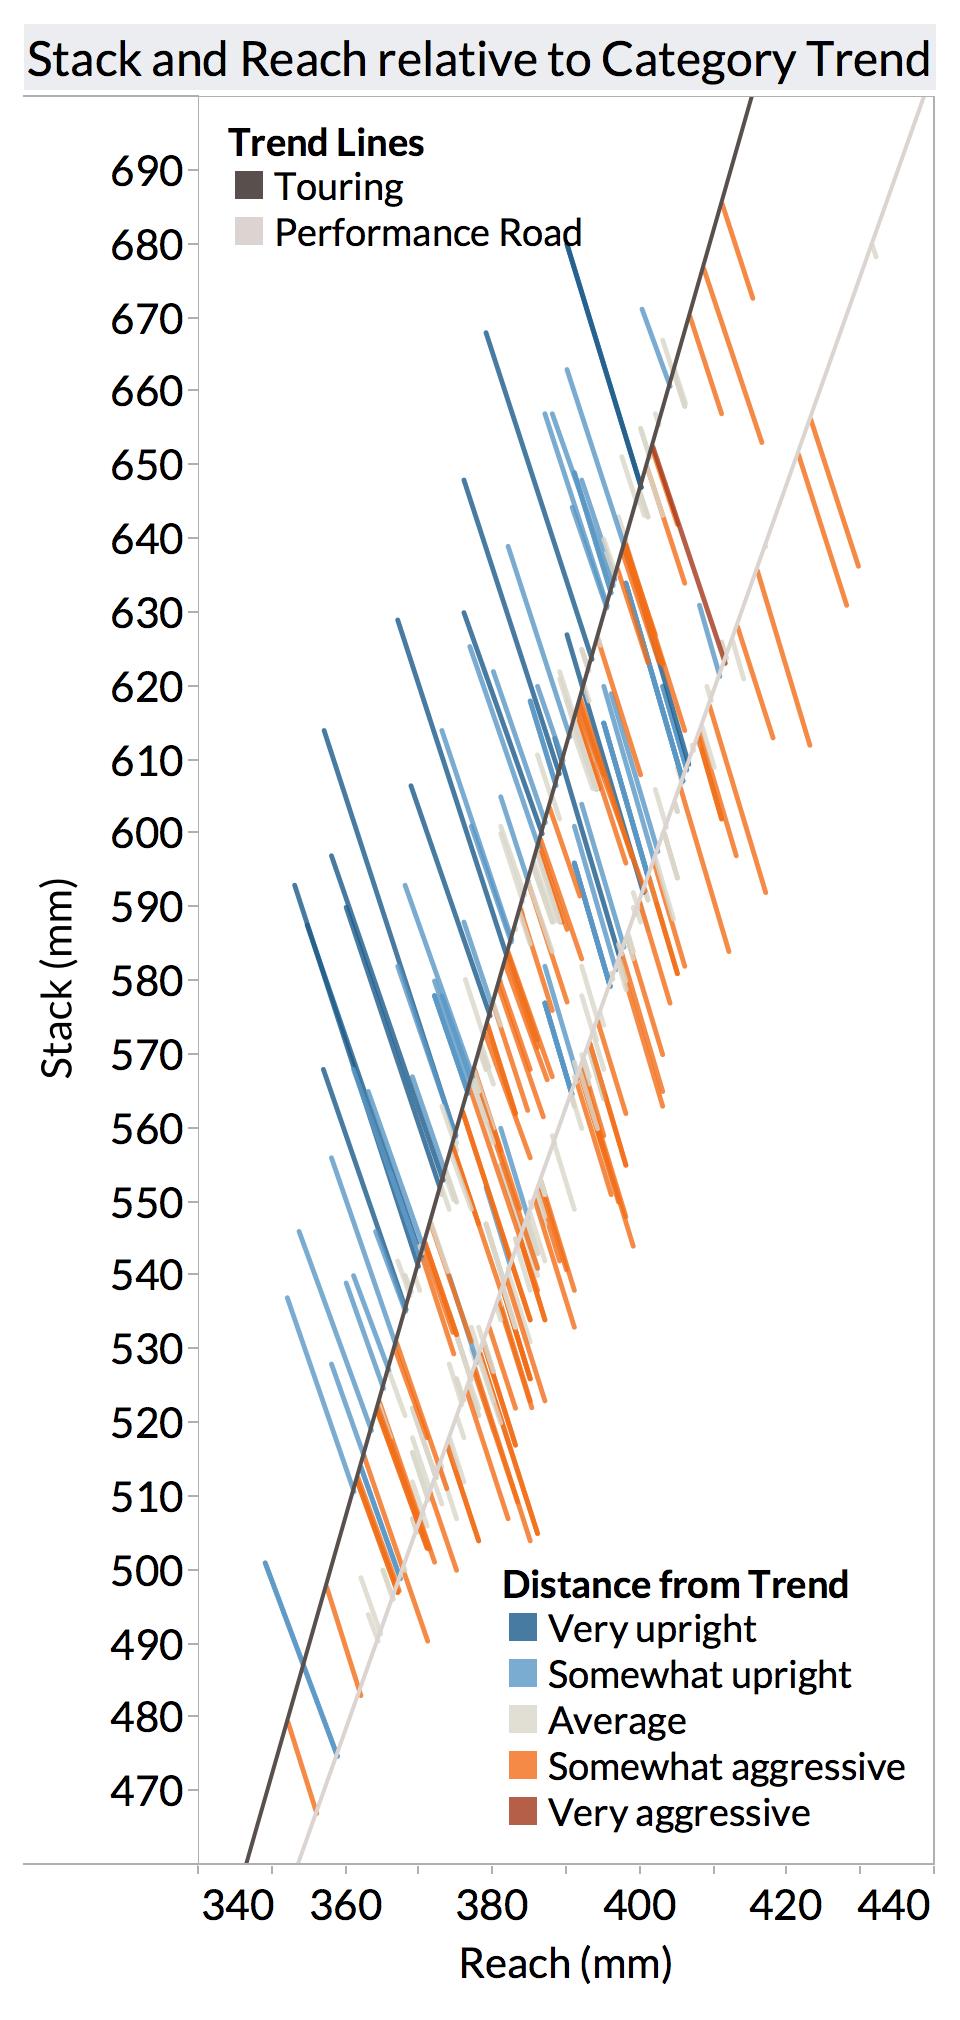
Example 2:
In this example, we’ve added Performance Road Bikes.
Notice how there are slight variations in the slope of these lines since the head tube angles of Performance Road Bikes tend to be steeper than those of Touring Bikes.
Also notice that some bikes overlap in the area between the trend lines. Whether we classify bikes in this area as upright or aggressive depends on the category. In other words, an upright Performance Road Bike might have similar proportions to an aggressive Touring Bike.
You might be wondering why we go through all this trouble instead of just measuring the closest distance between a bike’s Stack and Reach point and the trend line. For an explanation, take the example of the Crust Evasion we looked at earlier. With this system we calculate approximately the same point of intersection with the trend line for both of those bikes, correctly identifying them as being similar-sized despite having different head Tube Lengths.
If we were to simply calculate the closest distance to the trend line for these two bikes, this would result in different points of intersection, implying a difference in sizes.
Our research suggests that our calculation more closely aligns with real-world trends concerning the relationship between rider size and bike size, which we’ll talk much more about in a followup post.
Issues with the Upright-Aggressive Scale
We think that the usefulness of this scale far outweighs its shortcomings, but in the interest of transparency, we want to call out some potential issues:
- Trend lines are based on the Bike Insights database which is still in its early stages. We’re working to address data sparseness and sampling bias, but some volatility should be expected until the database reaches maturity.
- This analysis relies on a bike’s category being appropriately classified. Most of the time this is clear-cut, but there are some cases where we have bikes with a dramatically different fit. For instance, bikes designed around flat or swept-back handlebars but classified into a category with predominantly drop bar bikes will be represented as more aggressive. We will be taking steps to call out these scenarios in the short term and long term we will consider creating more granular trend lines accounting for these outlier designs.
- Cross-category comparisons are not supported. We are considering the ability to do “what if?” type analysis to compare a bike against a different category, but this is not yet available.
- All categories use the same, five-segment scale based on distance from the trend line in 20mm buckets. We’ve chosen to do so in order to prioritize consistency over more statistically precise methods such as standard deviation or quintiles. This means that some categories won’t have any Very upright or Very aggressive bikes because all bikes are within a +/- 30mm distance from the trend line.
The Big picture
To finish up this post, let’s revisit Stack to Reach Ratio and compare this to the Upright/Aggressive Scale.
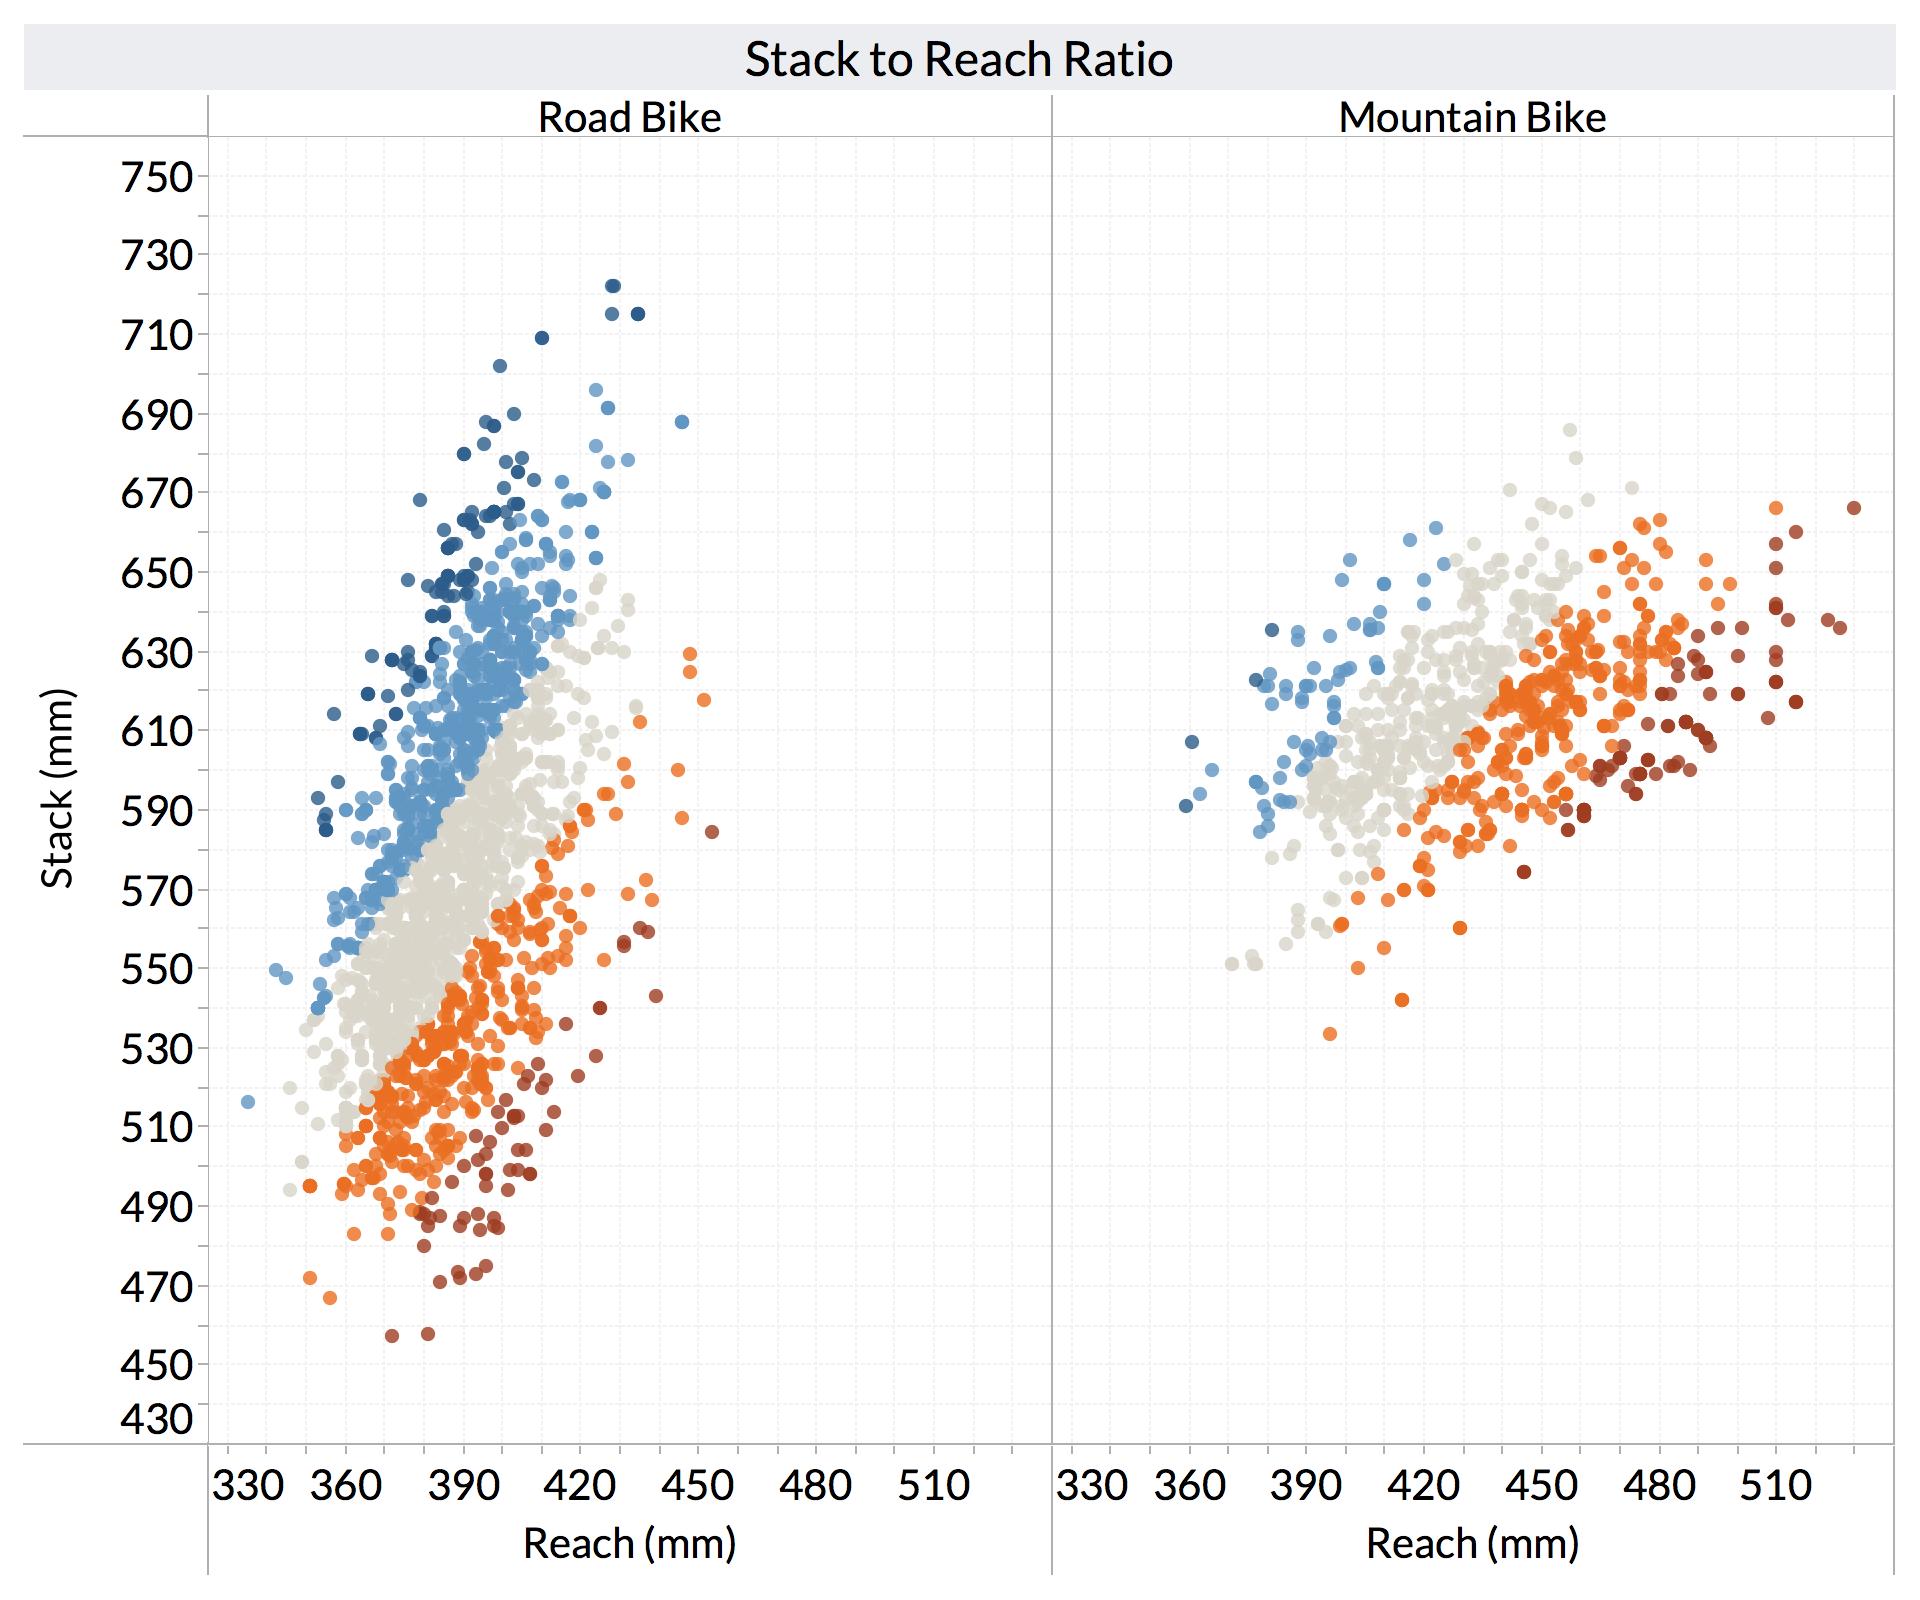
The chart above is what it looks like if we simply color code bikes based on their Stack to Reach Ratio (5 groups with colors scaled from min to max ratio). Notice that the slope of these color bands is the same for Road Bikes and Mountain Bikes and it doesn’t really fit the shape of these clusters, misrepresenting the expected distribution of proportions.
Now let’s compare that to a chart color coded by each bike’s Upright-Aggressive classification:
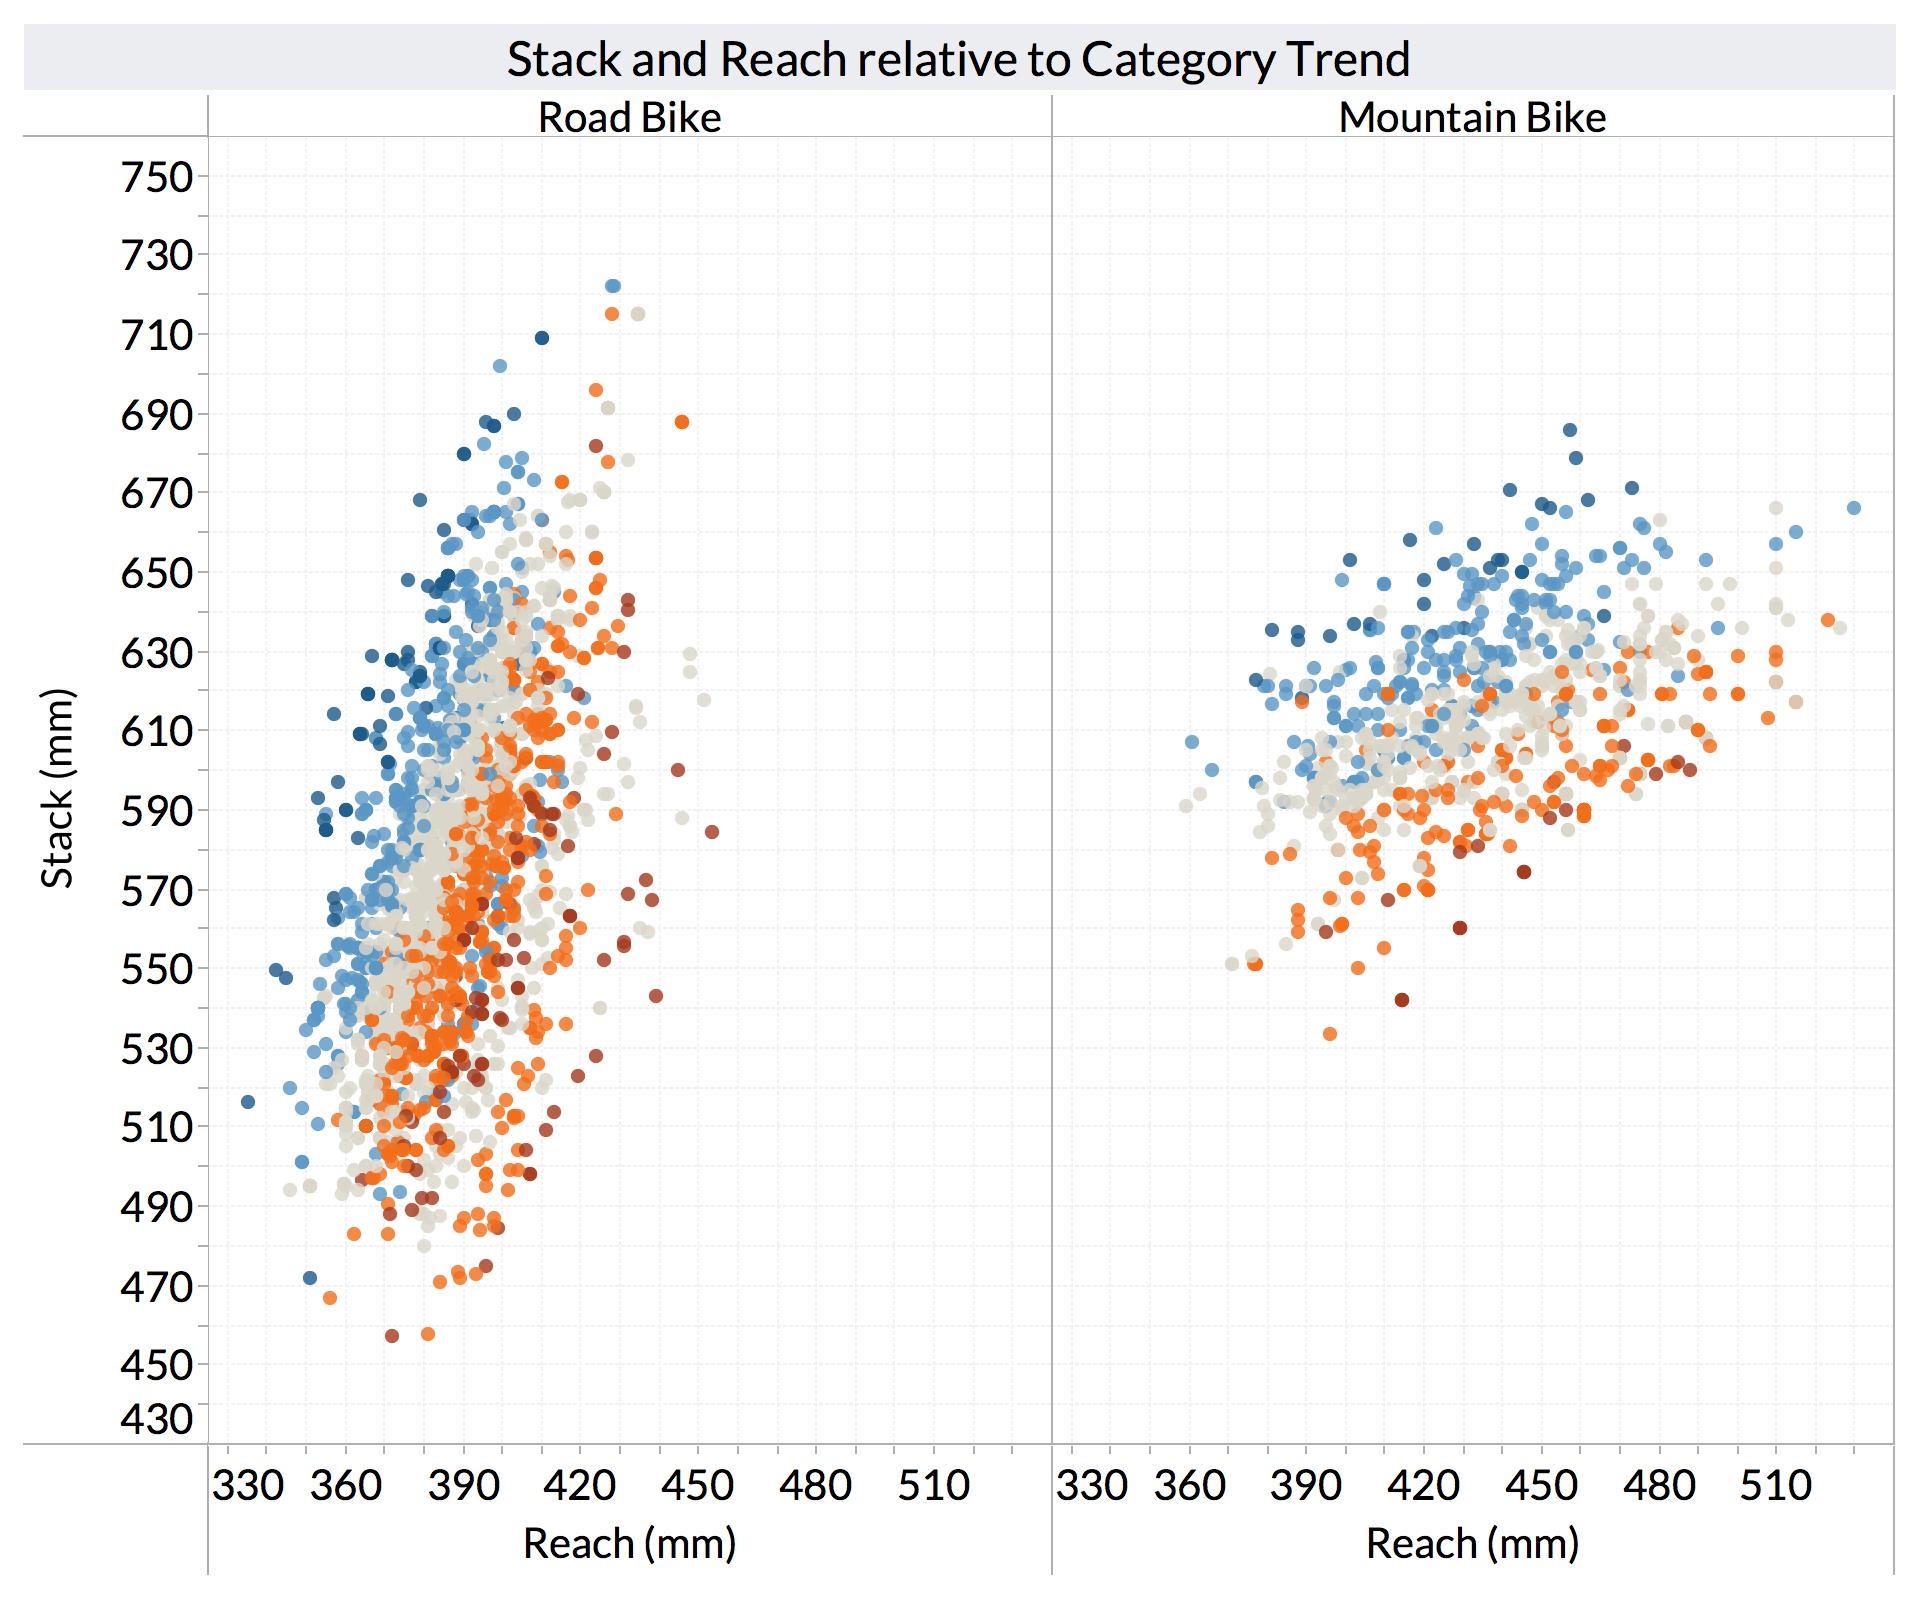
Notice how the color bands for Road Bike are steeper while those for Mountain Bikes are shallower, reflecting the distinct trends for these categories. The colors overlap and blend together in some areas because the more granular models at work here know that what is considered upright for one category may be aggressive for another category.
Stay tuned for more!
We have much more on the horizon and can’t wait to show you what’s next. Help us out by creating a free Bike Insights account. As you tell us which bikes you’ve ridden, we’ll use this crowdsourced data to bring you more great insights. You don’t have to be a bike nerd to participate, we want to hear from everyone!
If you liked this blog post, be sure to sign up to our mailing list in the sidebar to the right to stay in the loop. We promise not to send you spam!
Also, if you’d like to help get the word out about Bike Insights, give us a follow on Instagram and Twitter to help increase our visibility with other cyclists. Thanks!
If you liked this blog post, be sure to sign up to our mailing list below to stay in the loop. We promise not to send you spam!
Also, if you’d like to help get the word out about Bike Insights, give us a follow on Instagram and Twitter to help increase our visibility with other cyclists. Thanks!

Recent Comments