This is part one in a series of posts about using Stack and Reach to assess bike design. Today’s focus is on Stack to Reach Ratio, a metric that gets tossed around with some regularity in bike-nerd circles. We’ve recently seen it referenced in bike reviews, consumer guides, and even in bike company marketing materials.
What is Stack to Reach Ratio?
Stack to Reach Ratio is a metric that tries to answer the question “How upright or aggressive is this bike design?”.
If you’ll excuse a quick foray into Bike Geometry 101: the inputs to this ratio are Stack and Reach, measurements that describe the dimensions of a bike from the center of the bottom bracket to the top of the head tube. Stack is the vertical distance while reach is the horizontal distance. The reason we measure from these two spots is that they are points of reference for two of the three contact points on a bike (pedals/feet and handlebars/hands). Stack and Reach also avoid the inconsistencies of measuring a bike using Seat Tube Length and Top Tube Length.

Example of a bike with Stack of 592mm and Reach of 375mm.
Stack to Reach Ratio presents these measurements as a ratio of STACK ÷ REACH like so:
Bike Size |
Stack |
Reach |
Stack to Reach Ratio |
Small |
550 |
390 |
1.4:1 |
Medium |
600 |
400 |
1.5:1 |
Large |
650 |
410 |
1.6:1 |
Average of all sizes |
1.5:1 |
Seems Fine. What’s the problem?
- Averaging is a no-go: Oftentimes the Stack to Reach Ratios of multiple bike sizes are averaged together in an attempt to provide one ratio for a bike model. The flaw in this logic is evident if we try this on the example bike from the table above; an average ratio of 1.5:1 (average of 14:1 + 15:1 + 16:1) misrepresents 2/3 of the sizes in this case.
- Lack of context: Stack to Reach Ratio is difficult to interpret without some sort of context. Is a ratio of 1.5:1 upright or aggressive? Does a given ratio mean the same thing for small bikes as it does for large bikes? What about for different categories of bike? In the next section we’ll dig into some examples that show just how important it is to consider these factors.
Stack to Reach Ratio in the wild
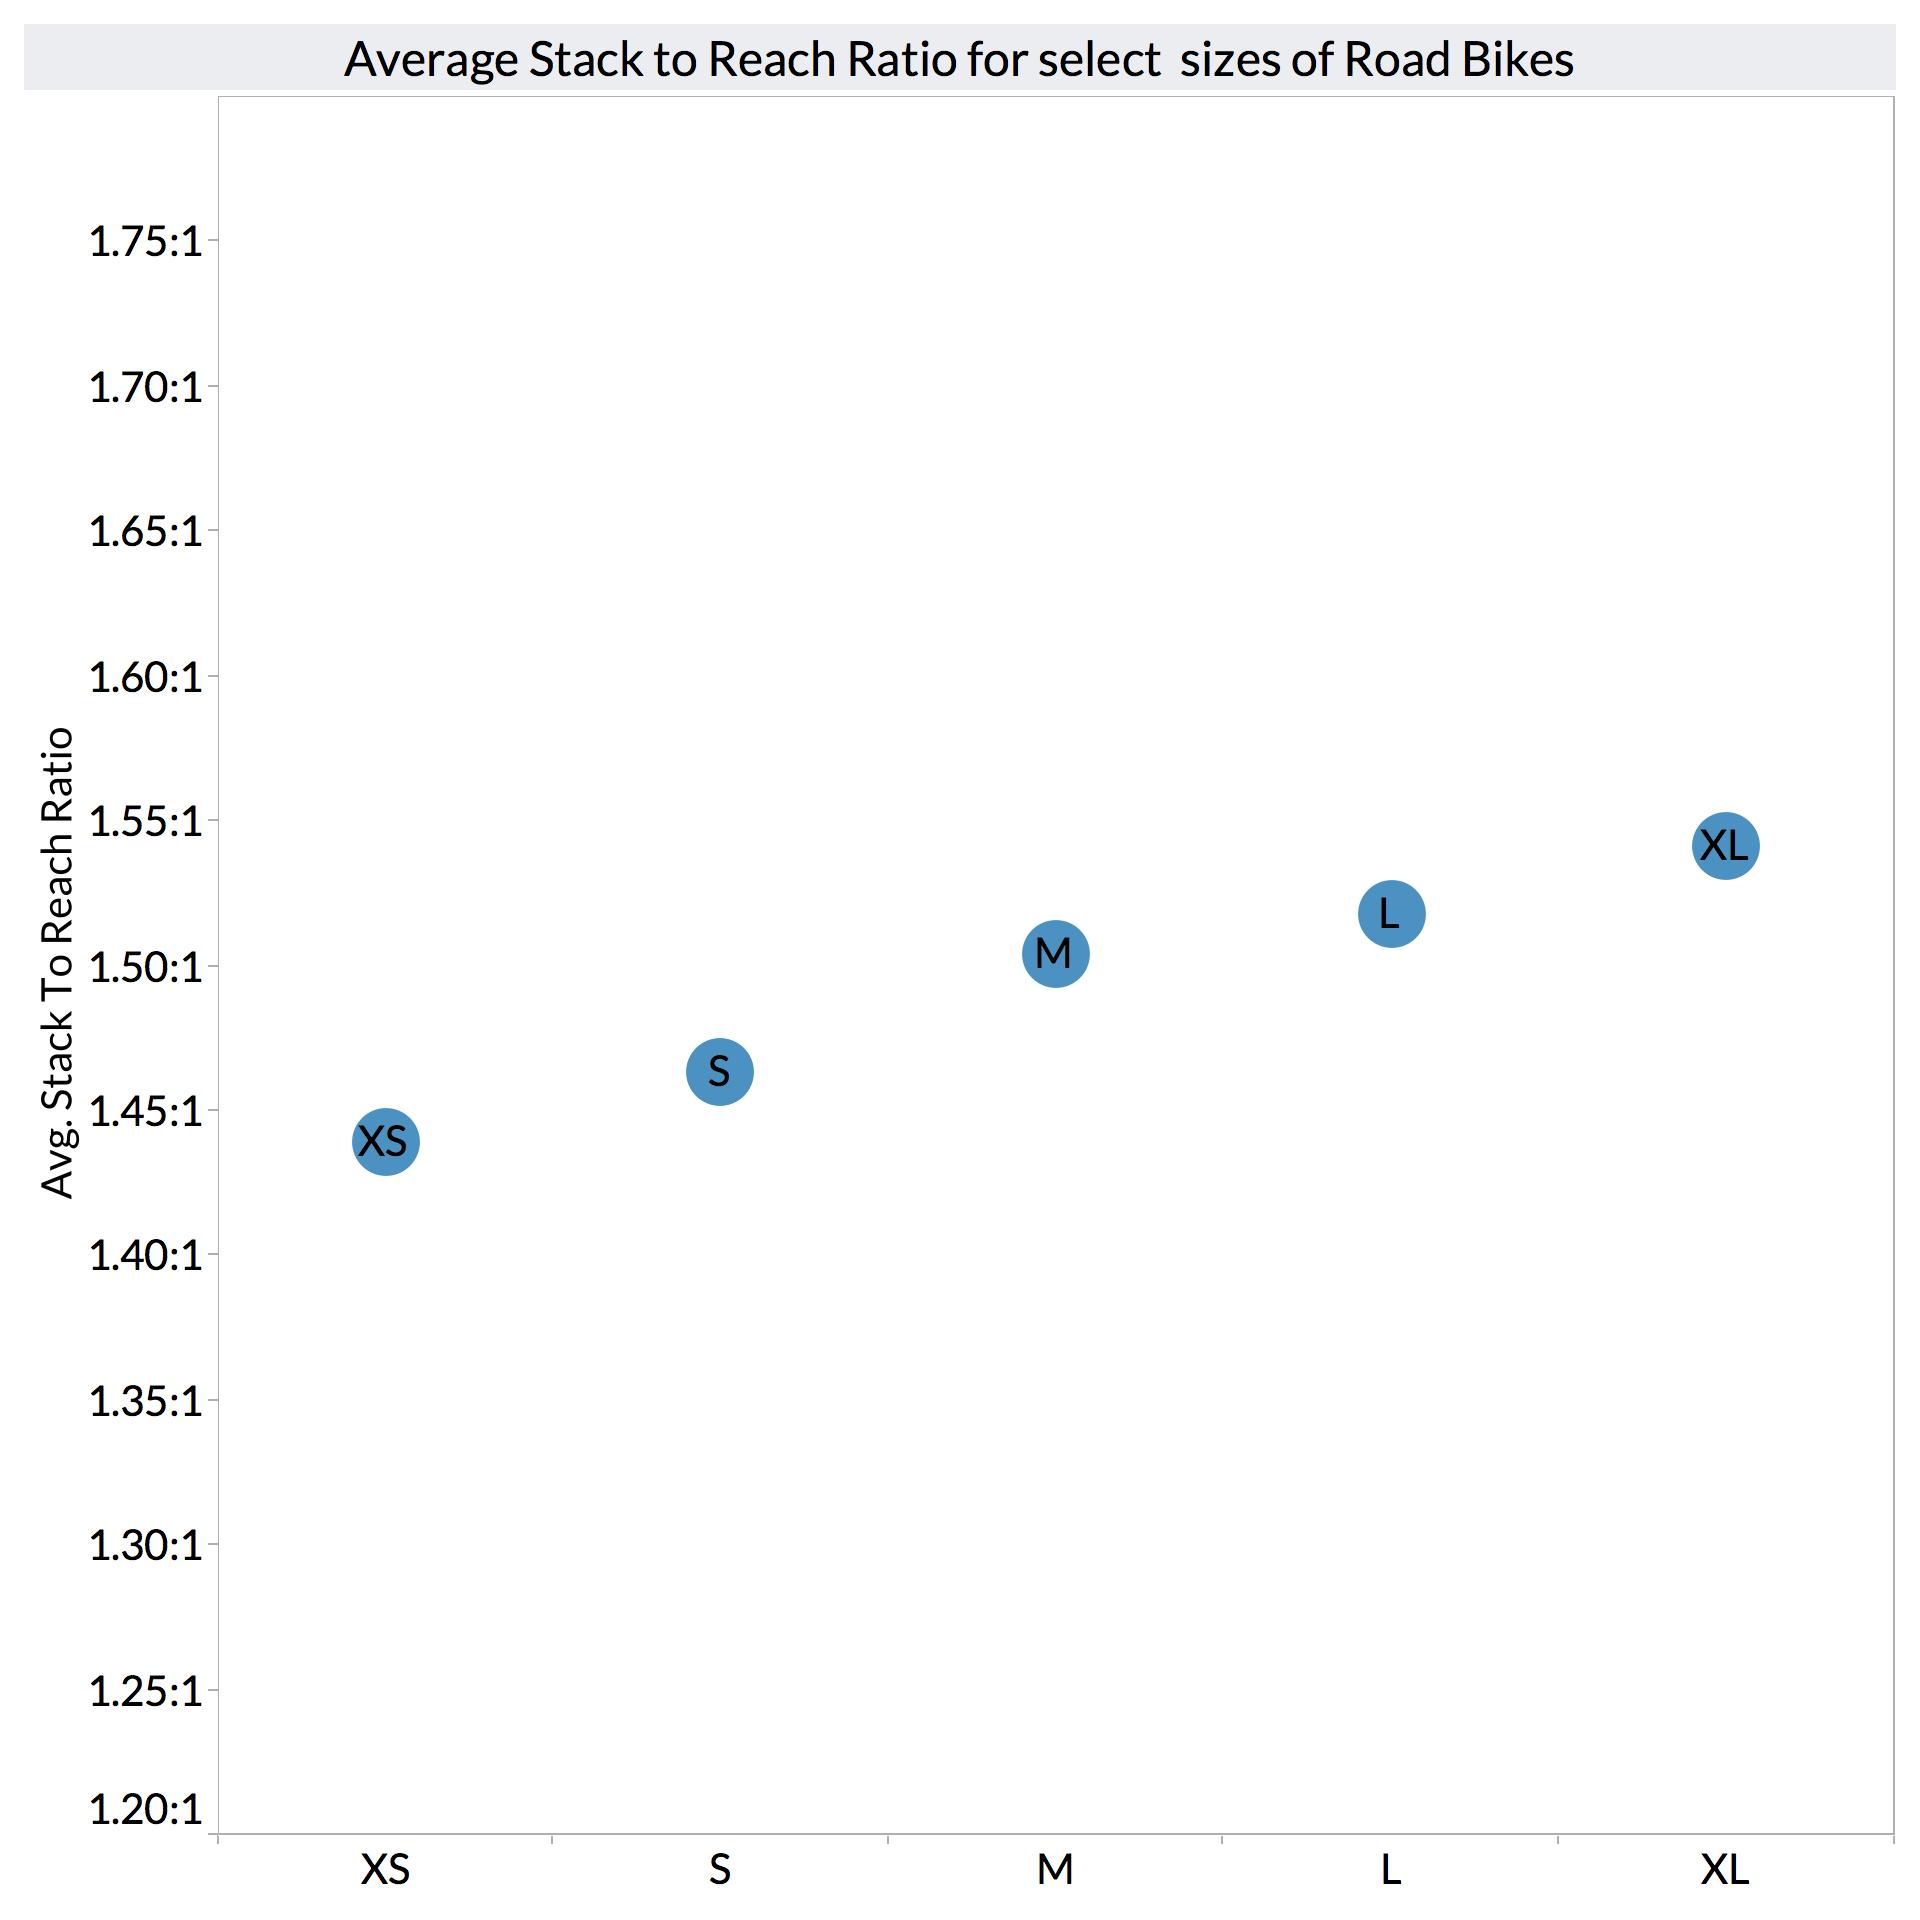
In the chart above, each dot shows the average stack to reach ratio for a nominal Road Bike size (smallest to largest from left to right). As Road Bikes progress from smaller sizes to larger sizes, Stack to Reach Ratio increases.
Yep, most bikes are intentionally designed with different proportions for each frame size.
Bike designers aren’t simply designing a Medium sized bike and then putting the plans through the copying machine set to “shrink” or “enlarge”. They are considering things like how average body proportions change with rider height and how to achieve desired handling, weight, and performance targets.
To illustrate how the intended usage of a bike can influence its design, let’s look at the same chart including Mountain Bikes.

As mountain bikes progress from smaller sizes to larger sizes, Stack to Reach Ratio decreases almost inversely proportional to the increase that we see in road bikes. Remember our question “Is a ratio of 1.5:1 upright or aggressive?” Looking at this chart, we might come away with a different answer to that question for each combination of category and size.
Even more problematic, we can’t really tell what is driving the change in ratio in the chart above. Let’s look at the same data in a different way:
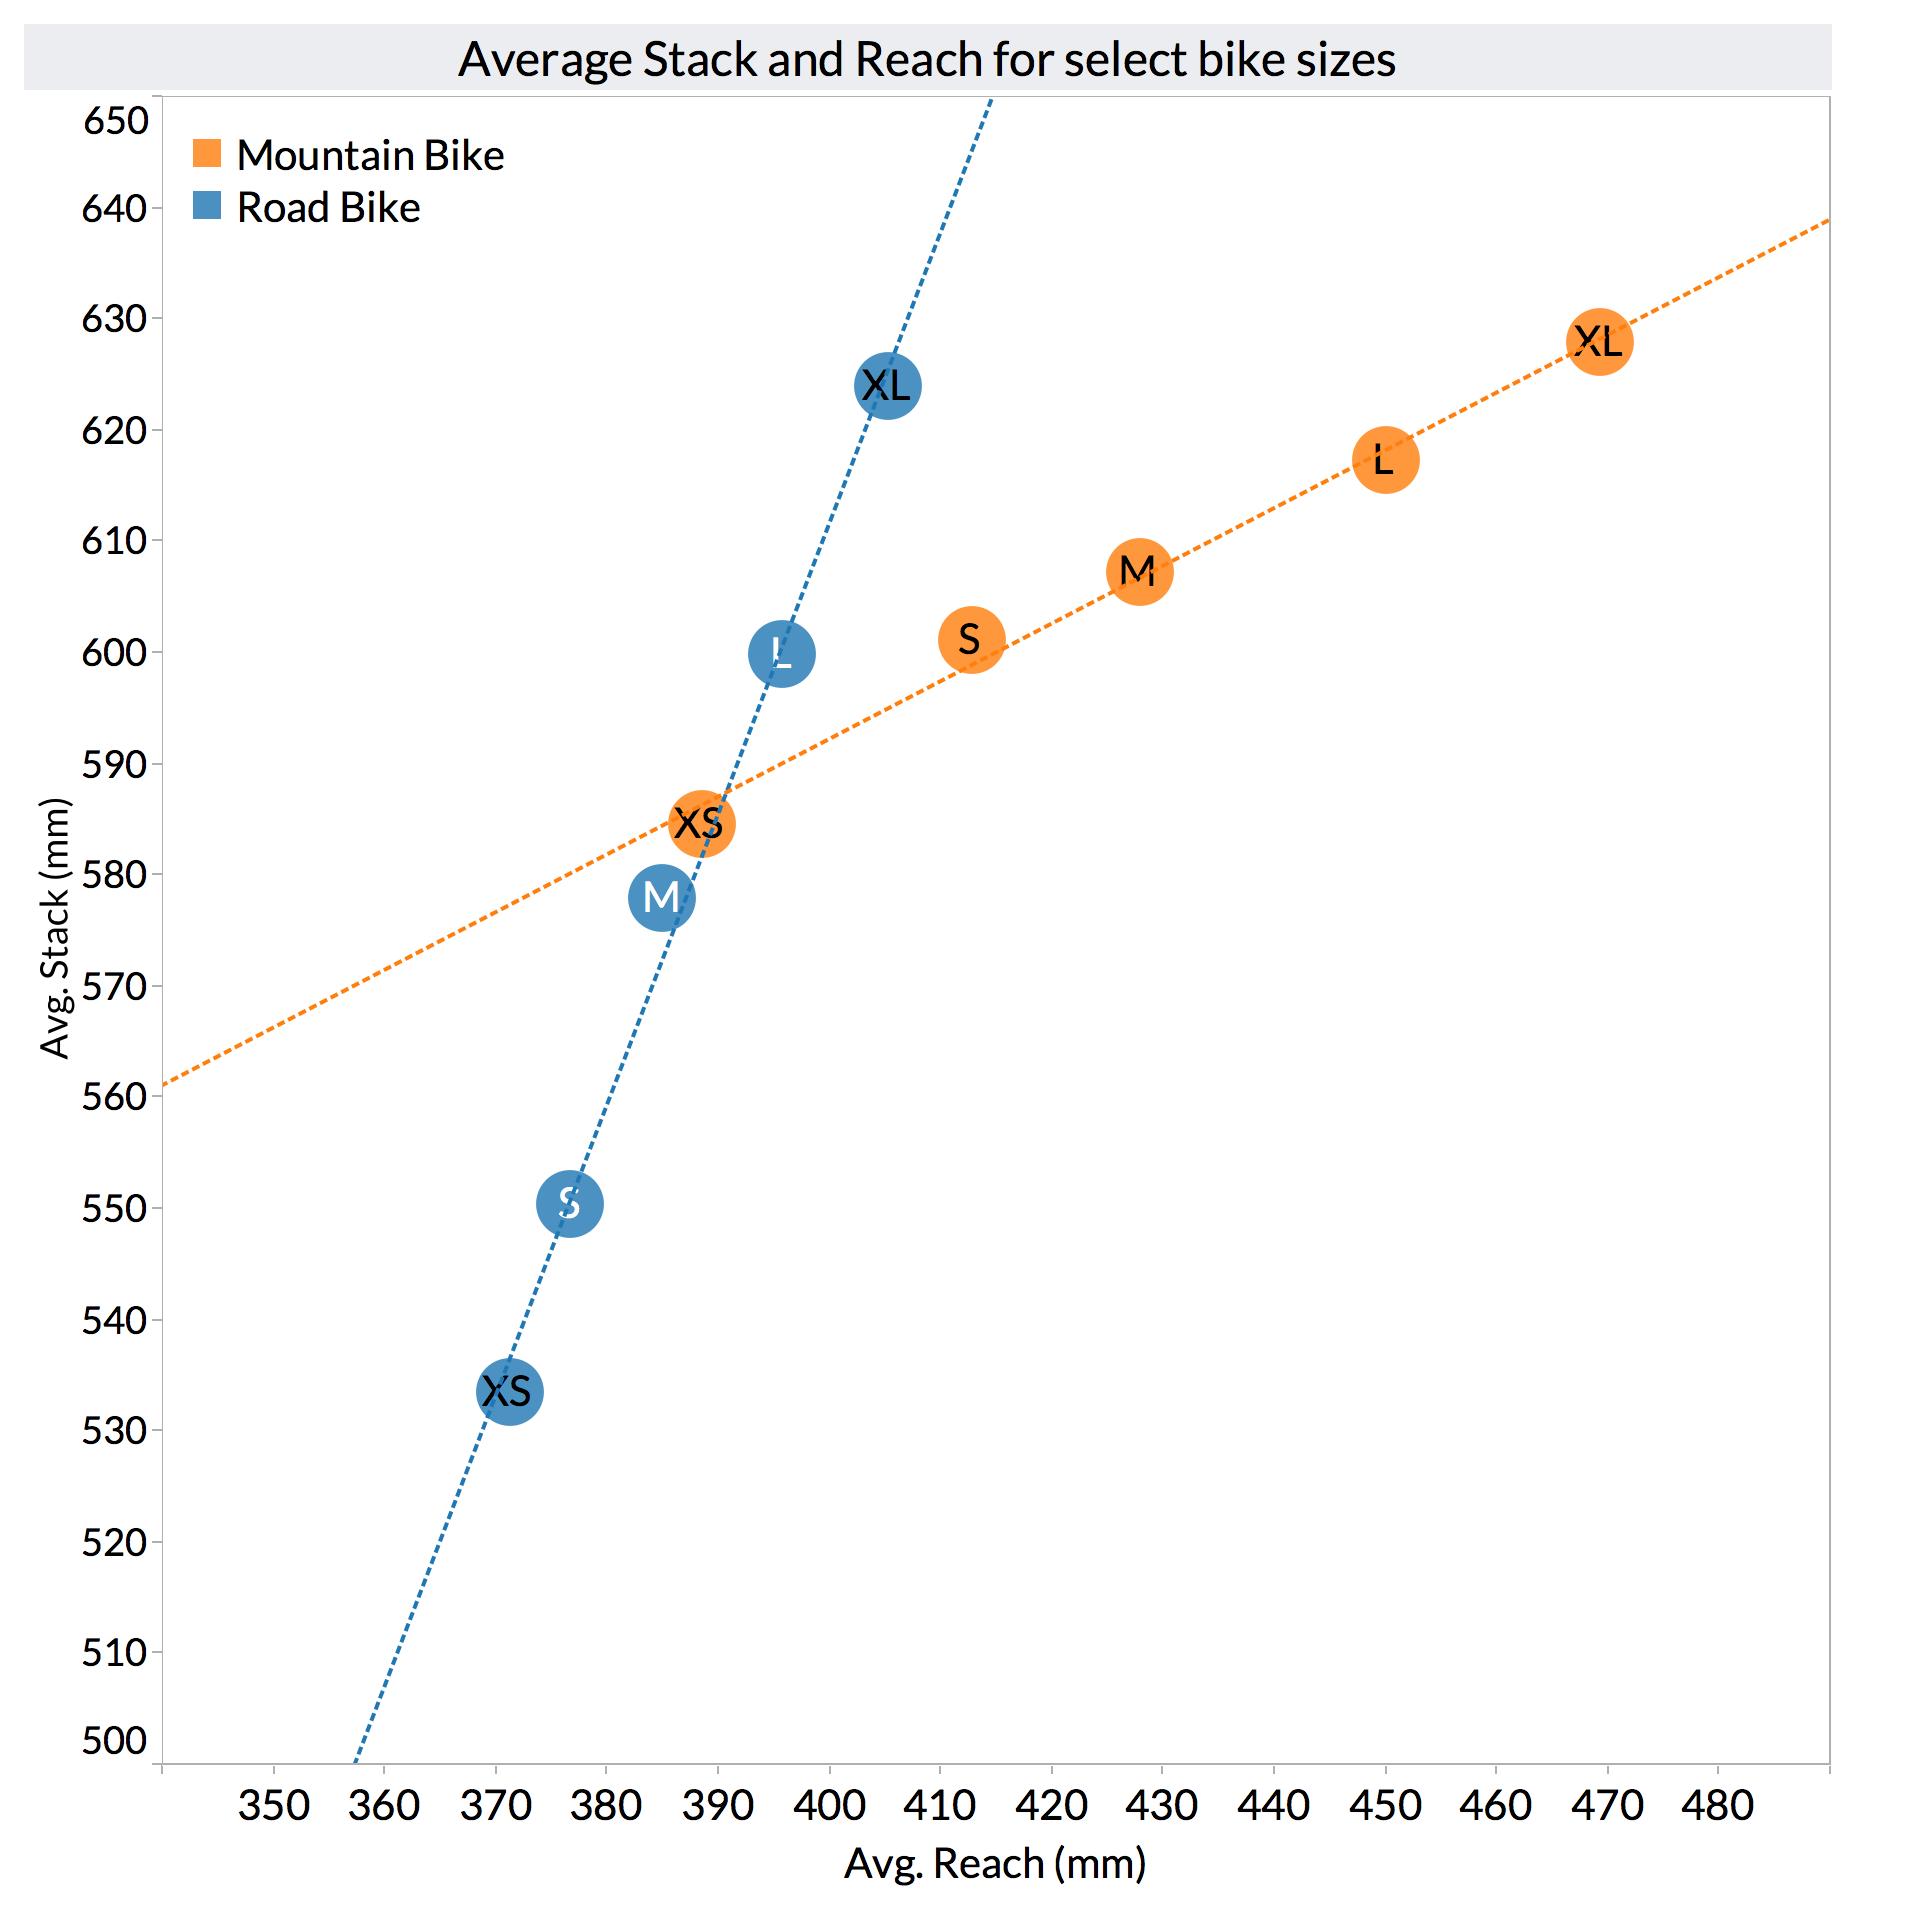
This chart shows the average Stack and Reach (not ratio) for the same size groups we looked at in the previous chart. Note the dotted trend lines which we’ll talk more about in part two of this series.
Studying this chart provides us with some observations that we’re missing if we just look at ratios:
- As Road Bikes size up, both dimensions increase but the most significant change is in stack.
- As Mountain Bikes size up, both dimensions increase but the most significant change is in reach.
- While the previous chart suggested that Small Road Bikes and Small Mountain Bikes have the same Stack to Reach Ratio of 1.46:1, they are actually of very different sizes.
We’ll look at some of the reasons for these design differences between Road and Mountain Bikes in a follow-up post, but if you want some clues in the meantime, consider that Stack and Reach measurements do not include cockpit components such as stems and handlebars.
Is there a better way?
On one hand, we know that Stack to Reach Ratio is fundamentally flawed. On the other hand, it’s overkill to delve into specific Stack and Reach numbers when trying to convey the general proportions of a bike. That’s like giving someone GPS coordinates when they just want to know what city you live in.
At Bike Insights, we’ve spent considerable time analyzing various approaches to this problem (some of you might remember my analysis of Chill-Factor, the angle between the horizontal plane and a line drawn from bottom bracket to the top of head tube) before finding them lacking.
The good news is that we think we have cracked the case.
In the next post in this series, we’ll show you how we are answering “How upright or aggressive is this bike design?” by contextualizing this with category trend analysis. It’s more exciting than it sounds, I promise. We think this is a profound way to analyze bikes that is dead-simple to understand and involves no math (yessssss!).
If you liked this blog post, be sure to sign up to our mailing list in the sidebar to the right to stay in the loop. We promise not to send ya spam!
Also, if you’d like to help get the word out about Bike Insights, give us a follow on Instagram and Twitter to help increase our visibility with other cyclists. Thanks!
If you liked this blog post, be sure to sign up to our mailing list below to stay in the loop. We promise not to send ya spam!
Also, if you’d like to help get the word out about Bike Insights, give us a follow on Instagram and Twitter to help increase our visibility with other cyclists. Thanks!

Recent Comments